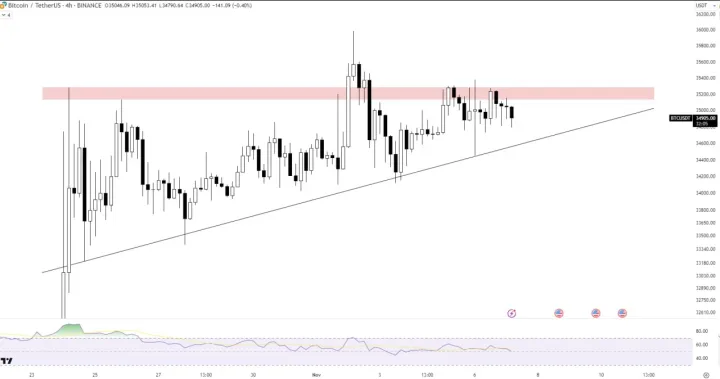
SEC aims to introduce an “innovation exemption” by December, allowing crypto firms to launch products faster.
@thecryptoexpress
Single destination for all your #crypto updates and resources. Most accurate TA/FA updates, latest #crypto news, Learning materials & many more.
SEC aims to introduce an “innovation exemption” by December, allowing crypto firms to launch products faster.
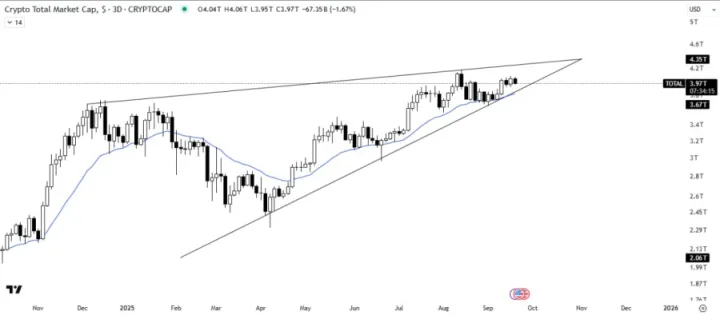
#TOTAL MARKET CAP ANALYSIS
The total crypto market cap is consolidating inside a rising wedge pattern, currently trading above the support trendline. The 21MA is acting as support, suggesting a possible bounce from this level.
On the other hand, a breakout above the wedge would invalidate the pattern and could pave the way for a new ATH. Keep an eye on the next move.
#ALTS MARKET CAP ANALYSIS
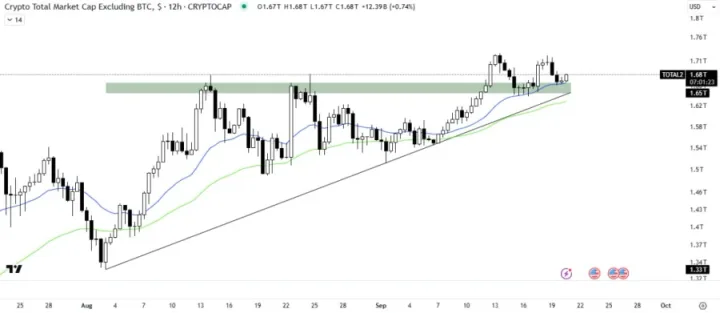
The ALTS market cap has broken out of the ascending triangle and is rebounding above the breakout level.
Both the 21MA and 50MA are acting as strong support, showing momentum.
If it continues to hold above this level, we can expect a strong bullish rally in the altcoin market.
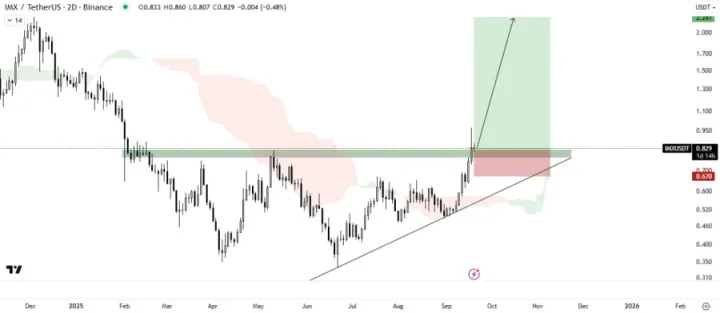
#IMX/USDT BUY SETUP
IMX has broken out of the ascending triangle with strong volume and is retesting the level, with the Ichimoku Cloud showing strength successful retest could confirm a bullish rally. 🚀
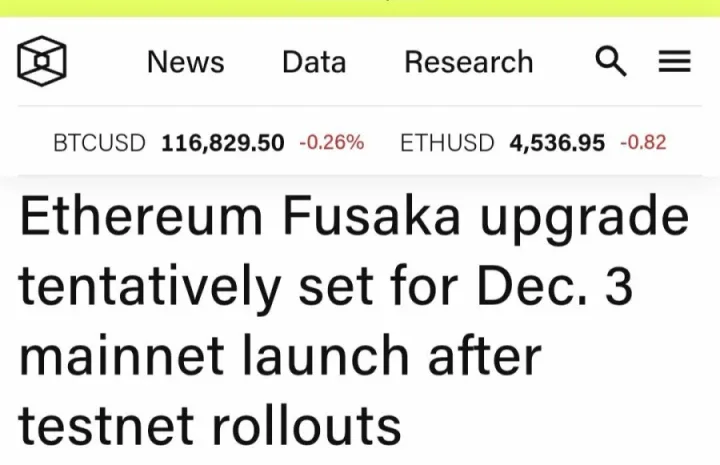
Ethereum Fusaka upgrade tentatively set for Dec. 3 mainnet launch after testnet rollouts.
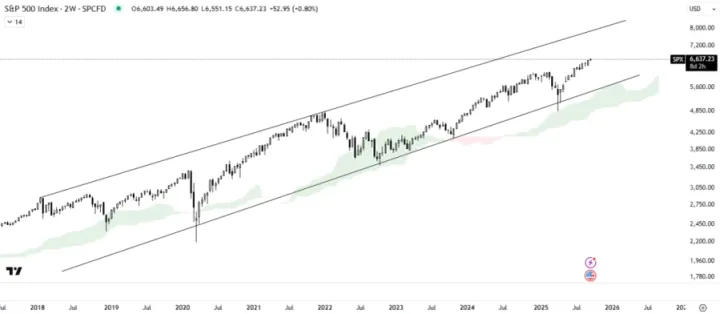
#S&P 500 ANALYSIS
The S&P 500 is rebounding from the support trendline of the ascending channel, with the Ichimoku cloud still signaling bullish momentum. This setup suggests the potential for a further upward rally.
Given the index’s strong correlation with the crypto market, its next move will be pivotal in shaping broader market sentiment making this a key level to watch.
3 days left until the MEGA PUMP SIGNAL on MEXC! This pump will be a special one, we can almost guarantee that it will be one of the biggest pump we have done. You can be sure that we will be taking all the necessary measures to make sure the pump succeeds big time just like the one we did on #JET (+10,600%). Stay tuned.
Pump Details:
Date: Sunday, September 21
Time: 5 PM GMT
Pairing: USDT
Exchange: MEXC
Advantage: Free For All
JUST IN: 🇺🇸 Fed Chair Jerome Powell says job gains have slowed due to 'lower immigration.'
🚨 BIG: 29 minutes left until the Fed meeting.
2:00 PM ET – Rates announcement
2:30 PM ET – Press conference with Jerome Powell
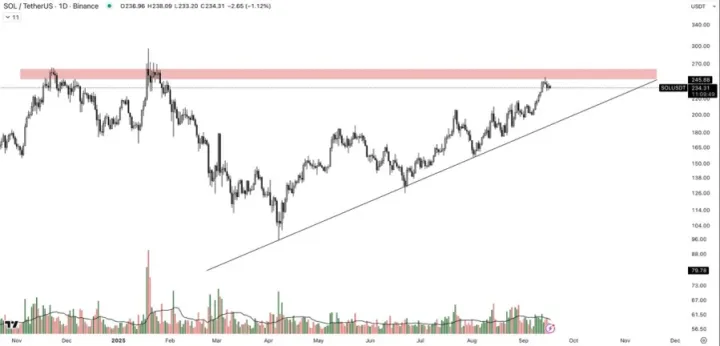
#SOL/USDT ANALYSIS
SOL is trading in a strong uptrend, respecting the ascending trendline. Price is currently facing a major horizontal resistance zone around $245–$270, which has previously acted as a strong supply area.
A breakout and daily close above this zone would signal strong bullish continuation. However, rejection here could lead to a pullback toward the trendline support around $210–$220.
JUST IN: 🇺🇸 Eric Trump calls crypto ‘perfect hedge’ to real estate assets.
Curve Finance pitches Yield Basis, a $60M plan to turn CRV into an income asset.

#BTC/USDT ANALYSIS
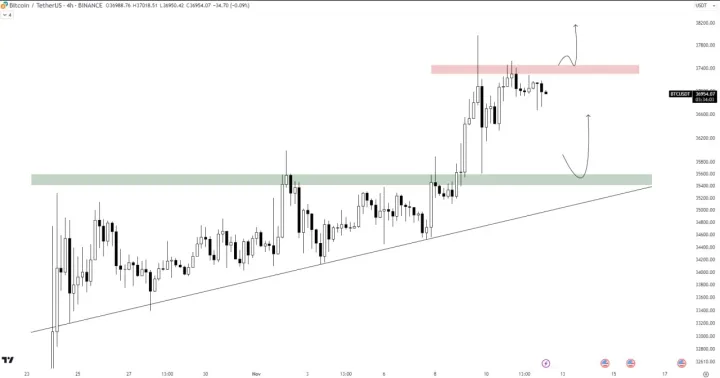
BTC pumped with a good volume after the breakout of the ascending triangle. Currently, it is facing horizontal resistance. A solid breakout of the horizontal resistance would be the further bullish confirmation. In case of a retracement, it will retest the triangle.
#XRP/USDT ANALYSIS
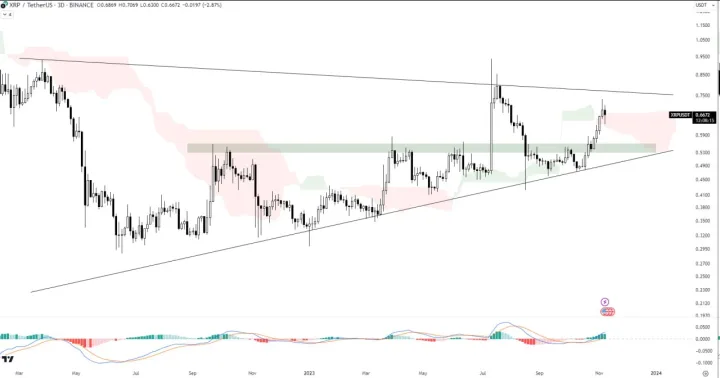
XRP is currently exhibiting a symmetrical triangle pattern. Presently, it maintains a position above the Ichimoku cloud and is trading below the trendline of the triangle. The MACD crossover signals a bullish momentum.
A decisive breakout from the triangle would serve as confirmation of the bullish trend. However, if it breaches the Ichimoku cloud, a retest of horizontal support is likely.
#US DOLLAR ANALYSIS
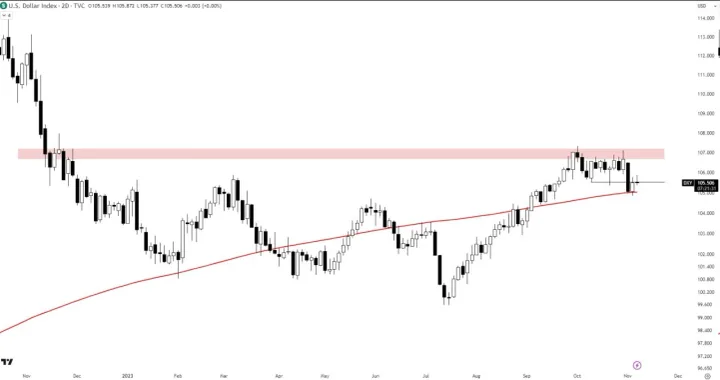
The US dollar has been rejected at the horizontal resistance, and it has also experienced a market structure break. Presently, it is maintaining a position above the 200-day moving average (MA).
A breach below the MA 200 would confirm a downward trend for the dollar. It's important to note its inverse relationship with the crypto market.
#DOGE/USDT ANALYSIS
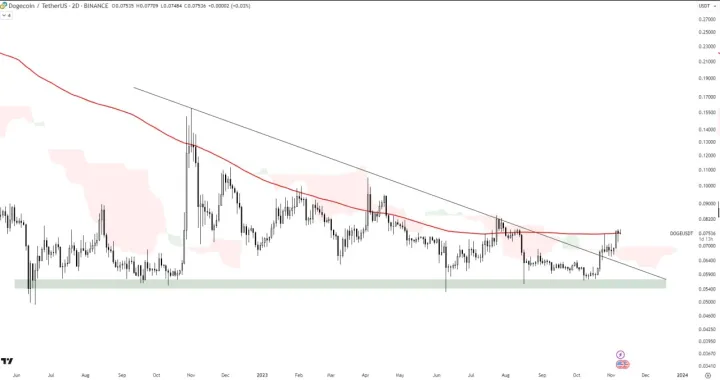
DOGE has broken out of the descending triangle with a successful retest. Currently, it is attempting to break above the MA 200. A candle close above the MA 200 would signal a bullish continuation. However, if it faces rejection, it is likely to retest the Ichimoku cloud.
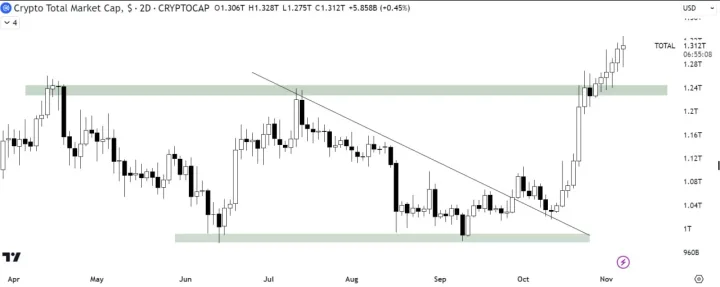
#TOTAL MARKET CAP ANALYSIS
The total market cap pumped significantly with high volume following a successful retest of the descending triangle. It broke past the previous high resistance, with bullish candle closes above it.
A continuation of the bullish trend is anticipated from this point onward or following a successful retest of the horizontal support in the event of a retracement.
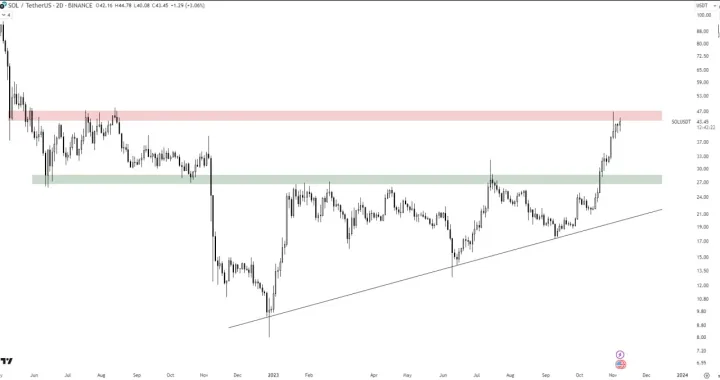
#SOL/USDT ANALYSIS
SOL pumped with a decent volume after the breakout of the ascending triangle. Currently, it is facing horizontal resistance. A solid breakout of the horizontal resistance would be the bullish confirmation. However, if it faces rejection, a correction may be anticipated.
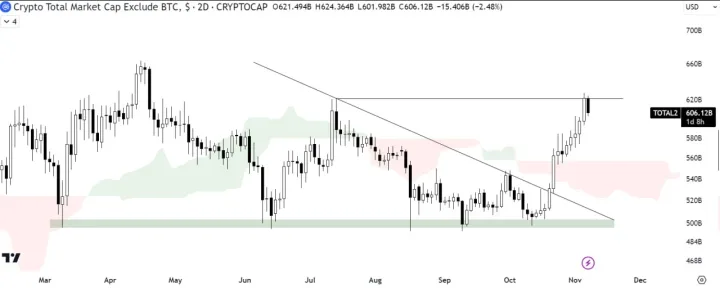
#ALTS MARKET CAP ANALYSIS
The ALTS market cap has sustained its bullish momentum following the breakout of the descending triangle and the Ichimoku cloud. It is currently encountering resistance at a previous high.
A decisive breakout above this past high resistance would confirm the continuation of the bullish rally. Conversely, if there is a rejection, we might witness a retest of the Ichimoku cloud.
#BTC/USDT ANALYSIS
BTC is currently forming an ascending triangle pattern on a 4-hour timeframe. The RSI is situated in the neutral zone, indicating a period of indecision between bulls and bears. It's crucial to monitor for a sustained breakout or breakdown to confirm the next directional move in the market.